

Recurring digital payments have quietly become a fixed feature of household finances across the UK, Europe and the United States. For revenues and benefits services, understanding their scale, their cross-national consistency — and their ambiguous status as essential or discretionary spending — is becoming increasingly relevant.
Revenues & Benefits Intelligence · Briefing Note
The Scale of Subscription Spending
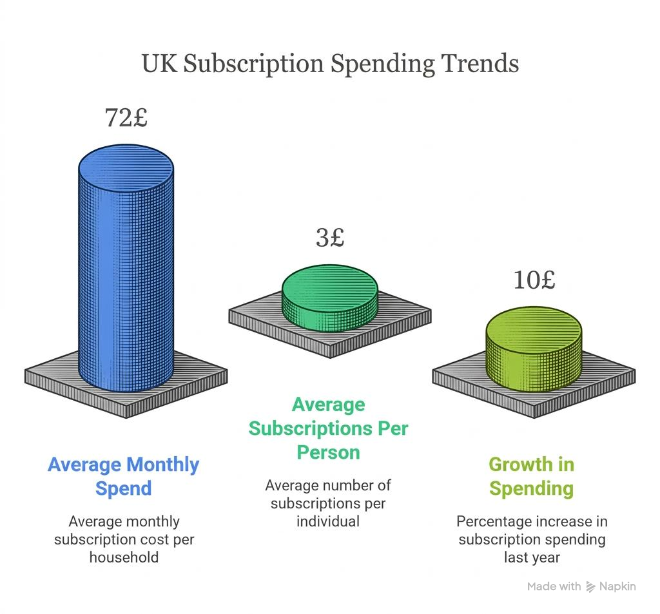
The typical Briton now spends around £72 a month on subscriptions and holds approximately three active services, according to reporting in The Times. That figure — equivalent to £864 a year — has risen by 10% over the preceding twelve months, suggesting that even significant cost of living pressure has done little to slow the expansion of recurring payments in household budgets.
The most popular services named include Apple, Amazon Prime, Netflix, Spotify and Giffgaff. What these have in common is that they are not purely entertainment: they cover cloud storage, mobile data, music, video and retail delivery — services that many households now treat as baseline infrastructure rather than lifestyle choices.
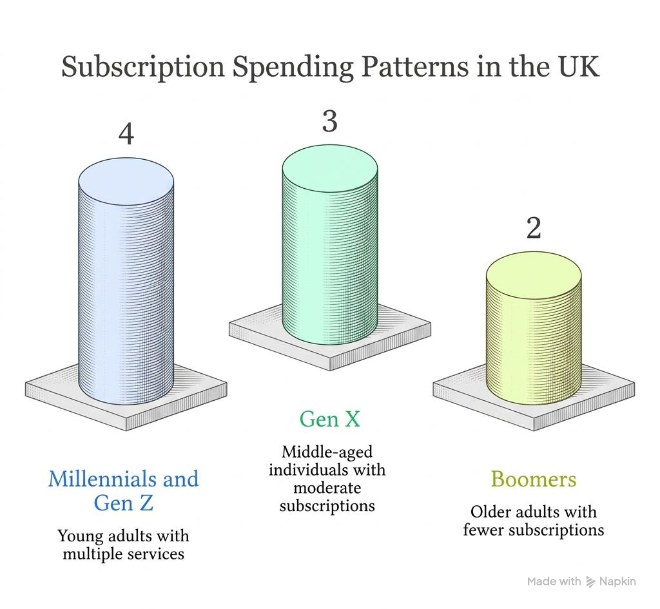
There are notable demographic patterns in the data. Men hold more subscriptions than women on average — a gap of around 14% — and are more likely to spend over £50 a month on streaming services alone (21% of men, compared with 14% of women). The generational divide is also stark: Millennials and Gen Z average around four subscriptions each, compared with three for Gen X and two for Boomers.
“At £72 a month, subscription spending now rivals many utility bills — yet it rarely features in standard affordability assessments.”
Implications for Revenues and Benefits Services
For revenues and benefits practitioners, these figures deserve attention for several reasons. Subscription spending sits on top of — not instead of — rent, council tax, food and energy costs. For lower income households, £72 a month in recurring digital payments represents a meaningful fixed commitment that reduces the financial margin available before arrears become a risk.
The generational pattern adds a further dimension. Younger adults, who are already more likely to be renting and facing elevated housing costs, are also carrying the heaviest subscription burden. Millennials and Gen Z holding an average of four subscriptions each are navigating a more complex financial picture than the raw income figures alone would suggest. This may increase the need for structured budgeting support and more nuanced affordability conversations in debt advice, welfare and discretionary support work.
⚠ Practice Note
The evidence suggests that subscriptions are increasingly tied to digital access, everyday administration and convenience rather than pure luxury. Support services should be cautious about treating all subscription spending as obviously discretionary when assessing financial hardship. Mobile data, cloud storage and delivery memberships may function as essential infrastructure for some households — particularly those managing work, benefits claims or healthcare online.
An International Picture: USA and Europe
The UK data does not stand alone. Research from the United States and across Europe confirms that subscription spending is a structural feature of household finances in all advanced economies — while also revealing some important differences in scale, behaviour and awareness that have direct relevance for practitioners.
In the United States, the numbers are considerably higher than in the UK. Deloitte’s 2025 Digital Media Trends survey found the average American pays for four streaming services alone at a combined monthly cost of $69 — a 13% year-on-year increase. When all subscription categories are included — software, cloud storage, fitness, food delivery, music and more — the number of active subscriptions per person climbs to 8.2. The total monthly outlay sits far above the UK average of £72, with some estimates placing typical all-in American subscription spending well above $200 a month.
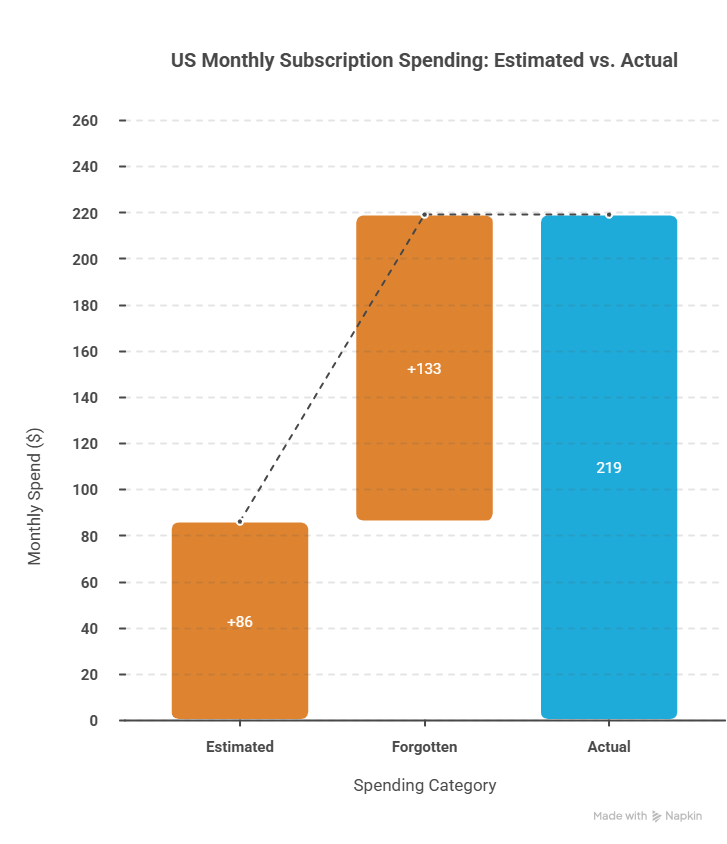
Perhaps the most significant finding from US research is the scale of the perception gap: the distance between what people think they spend and what they actually spend. Research by C+R Research found that consumers estimated their monthly subscription spend at $86, while their actual itemised total averaged $219 — a gap of roughly 2.5 times. West Monroe’s data found that 89% of consumers underestimated their subscription spending. The behavioural drivers are well evidenced: three-quarters of US consumers (74%) said it is easy to forget about recurring charges, 72% have all subscriptions set to auto-pay, and 42% admit they have forgotten about a subscription entirely while still being charged for it.
“89% of US consumers underestimate their subscription spending — a finding that reframes the ‘subscription audit’ from a nice-to-have into a genuine financial necessity.”
There are also signs that US consumers are beginning to push back. Deloitte found that nearly half (47%) of those surveyed said they pay too much for the streaming services they use, and 41% believe the content available is not worth the price — up 5 percentage points from 2024. Nearly half of US consumers cancelled at least one paid streaming service in the previous six months, with 71% citing price increases as the primary reason.
European adoption is lower than in the US but growing steadily. Deloitte’s research tracks the average number of streaming subscriptions in European households rising from 1.3 in 2018 to around 2.35 by 2024 — roughly half the US streaming average, and below the UK figure for all subscriptions combined. Country-level variation is significant. Research by Deloitte Belgium found that while more than 35% of global consumers have at least one active retail subscription, European adoption rates lag behind the US and vary considerably across markets.
The European data also contains a finding particularly relevant to revenues and benefits work: lower-income households in Europe tend to subscribe to replenishment services for essential goods such as food and beverages, while higher-income households are more likely to hold subscriptions in discretionary categories such as pet care and leisure. This income gradient directly challenges any assumption that subscription spending is primarily a middle-class or affluent behaviour — and reinforces the case for treating subscription review as a routine part of financial support conversations across all income groups.
🌍 Global Context
Globally, 78% of adults now have at least one paid subscription, according to a 2025 Zuora report. The average consumer holds 5.6 active subscriptions across all categories, and 41% of consumers say they experience subscription fatigue. The global subscription economy was valued at approximately $536 billion in 2025 and is projected to reach $859 billion in 2026, with North America accounting for 38% of that market.
Taken together, the international evidence strengthens several conclusions relevant to UK practice. The perception gap — consistently documented in US research — is likely to apply in the UK context too, suggesting that households may genuinely not know their total subscription commitment without being helped to map it. The income gradient in European data supports a cautious, non-judgemental approach to subscription review. And the scale of the global market indicates that subscription spending is not a passing trend but a permanent feature of household financial management that support services need to engage with systematically.
Drawing the Line: Essential Versus Non-Essential
Perhaps the most consequential judgement for practitioners is not simply how much a household spends on subscriptions, but which of those subscriptions are genuinely essential to daily life and which represent adjustable expenditure. This distinction is rarely straightforward.
A broadband bundle or mobile data package that enables a claimant to access Universal Credit, attend a remote medical appointment or receive payslips electronically occupies a fundamentally different category from a duplicate streaming service retained out of habit. Yet both may appear on a bank statement as a recurring direct debit of similar value. The challenge for practitioners is building the judgement to tell them apart — and to support clients in doing the same — without applying a blanket assumption in either direction.
Several factors complicate the classification. Subscriptions are frequently bundled, meaning a single payment may include both functional and discretionary elements. They are often set to auto-renew without active review. And they may have been taken out during a period of greater financial resilience that no longer applies. The result is a category of spending that deserves a structured, case-by-case approach rather than a blanket rule.
The checklist below offers a practical framework for use in income maximisation, debt advice or budgeting support conversations. It is designed not to prescribe outcomes, but to prompt the right questions — helping practitioners and clients work through the essential/non-essential distinction together with consistency and fairness.
✦ Practitioner Checklist: Assessing Subscription Spending
For use in income maximisation, debt advice and budgeting support conversations. Work through each category with the client to distinguish essential, borderline and discretionary commitments.
Step 1 — Build a complete picture
- List all active subscriptions from bank and card statementsInclude direct debits, standing orders and card-on-file recurring charges
- Identify the cost and frequency of each paymentNote monthly vs annual billing — annual payments can distort monthly budget views
- Calculate total monthly subscription commitmentCompare against net income to establish proportion of fixed outgoings
- Check for duplicated servicesE.g. two music streaming platforms, or a broadband deal that already includes a media package
Step 2 — Test for essential function
- Does the subscription provide connectivity or digital access?Mobile data, broadband, cloud storage used for work or benefits administration
- Is it required for employment or self-employment?Software licences, professional tools, communication platforms
- Does it replace a higher-cost essential (e.g. transport, childcare)?Delivery memberships or app-based services that reduce cost elsewhere
- Does it support health, wellbeing or a caring responsibility?Including mental health apps, medication delivery, or accessibility tools
Step 3 — Assess discretionary or adjustable spend
- Is the subscription actively used in the past 30 days?Unused subscriptions are a clear candidate for cancellation
- Could a free or lower-cost alternative meet the same need?Free-tier versions, library access, shared household plans
- Is the subscription retained from a previous financial position?Taken out when income was higher; not consciously renewed
- Is it a bundled service where only part of the value is used?Consider whether the core need can be met more cheaply elsewhere
Step 4 — Support the client’s decision
- Have you avoided applying a blanket ‘luxury’ label to digital services?Treat each subscription on its own merits in the context of this household
- Has the client been supported to make their own informed choice?Advice should inform, not direct — the decision remains with the client
- Has the review been documented as part of the budgeting record?Useful for future reviews, debt advice plans and hardship assessments
- Has the household been signposted to broader income maximisation support?Benefits entitlement checks, tariff switching, debt advice referral where appropriate
Key Numbers at a Glance
| Metric | Figure |
|---|---|
| United Kingdom | |
| £72 | Average monthly subscription spend per person |
| ~3 | Average number of subscriptions per person |
| +10% | Growth in UK subscription spending over the last year |
| 14% | Gap between men’s and women’s average subscription count |
| 21% / 14% | Men / women spending over £50/month on streaming |
| 4 (Millennials & Gen Z) · 3 (Gen X) · 2 (Boomers) | Average subscriptions by generation |
| Top 5 (UK) | Apple, Amazon Prime, Netflix, Spotify, Giffgaff |
| United States | |
| $69/month | Average spend on streaming services alone (Deloitte, 2025) — +13% year-on-year |
| 8.2 | Average total subscriptions per person across all categories |
| $219 vs $86 | Actual vs estimated monthly subscription spend — consumers underestimate by 2.5× |
| 89% | Share of US consumers who underestimate their subscription spending (West Monroe) |
| 47% | US consumers who cancelled at least one streaming service in the past six months |
| 74% | Consumers who say it is easy to forget about recurring subscription charges |
| Europe & Global | |
| 1.3 → 2.35 | Average streaming subscriptions per European household, 2018 to 2024 (Deloitte) |
| 35%+ | Global consumers with at least one active retail subscription |
| 78% | Adults worldwide with at least one paid subscription (Zuora, 2025) |
| 5.6 | Average subscriptions per consumer globally |
| $536bn → $859bn | Global subscription economy value 2025 to 2026 (Fortune Business Insights) |
Note on inferences: The implications for revenues and benefits services set out in this briefing are professional inferences drawn from the scale, growth and demographic profile of subscription spending as reported across the cited sources. The UK-specific service inferences are drawn from The Times reporting. International comparisons draw on Deloitte, Zuora, C+R Research and West Monroe data. None of these inferences are conclusions stated by the original sources.
References
Smart, Y. (2026). Average Briton spends £72 per month on subscriptions. The Times, 29 March 2026.
Deloitte (2025). 2025 Digital Media Trends. Deloitte LLP.
Deloitte Belgium / Comeos (2024). Subscription Models in Belgium. Deloitte Belgium.
Zuora / The Harris Poll (2025). Subscription Economy Index 2025. Zuora Inc.
C+R Research (cited in resubs.app, 2026). Subscription Spending Statistics.
West Monroe (cited in resubs.app, 2026). Subscription Spending Statistics.
Fortune Business Insights (2025). Subscription E-commerce Market Report.