
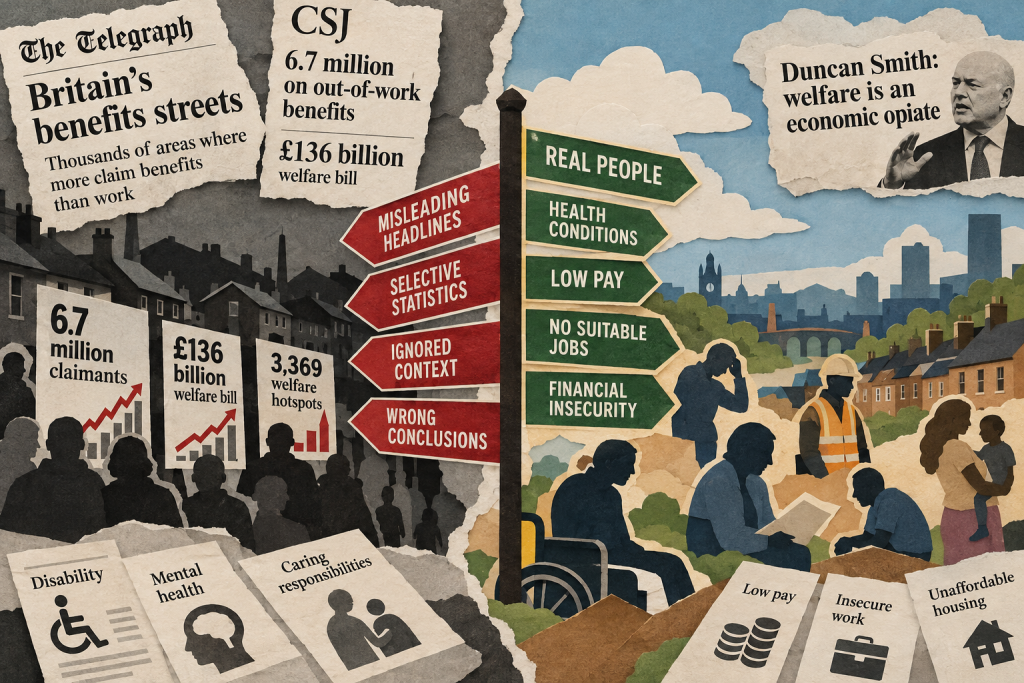
The Centre for Social Justice and the Daily Telegraph have identified a genuine problem with Britain’s welfare system. But their presentation of the evidence risks turning a serious debate about poverty, ill health and economic inactivity into another campaign against benefit claimants.
The problem is not necessarily the numbers. It is what we are being told they mean.
The Daily Telegraph has published another alarming account of Britain’s supposed welfare dependency crisis, drawing on research from the Centre for Social Justice (CSJ) and accompanied by commentary from former Conservative leader and Work and Pensions Secretary Sir Iain Duncan Smith.
We are told that thousands of neighbourhoods have more people claiming out-of-work benefits than working, that 6.7 million people are receiving such benefits, and that the working-age welfare bill is approaching £136 billion.
Duncan Smith describes the welfare system as an economic opiate, numbing the pain of stagnation while perpetuating dependency.
It is an arresting description. Unfortunately, the evidence presented does not justify such a sweeping diagnosis.
There is a serious problem with economic inactivity in Britain. There is also a serious problem with long-term ill health, inadequate employment opportunities, low pay, insecure work and communities that have experienced decades of economic decline.
But those are not necessarily problems caused by excessive welfare generosity.
The CSJ and the Telegraph have taken a series of statistics, some undoubtedly important, and used them to construct a narrative in which the benefit system itself becomes the principal villain.
The difficulty is that counting people receiving benefits does not tell us why they need them, whether they can work, whether suitable employment exists or whether reducing their income would improve their circumstances.
That distinction is not an academic technicality. It goes to the heart of whether the country develops effective welfare reform or simply repeats another cycle of benefit restrictions, poverty and political recrimination.
1. The 3,369 welfare hotspots: a headline designed to shock
The CSJ identifies 3,369 neighbourhoods in England and Wales where the number of people receiving specified out-of-work benefits exceeds half the estimated working-age population.
The Telegraph presents this as evidence of an extraordinary national crisis.
But the CSJ examined approximately 190,000 small statistical areas.
The 3,369 areas represent approximately 1.8% of those neighbourhoods.
Put another way, more than 98% do not meet the threshold used to generate the headline.
This does not diminish the difficulties experienced in those communities. Concentrated deprivation is a genuine policy concern.
It does, however, challenge the impression that most of Britain has become a collection of streets where benefits have displaced employment.
There is also an important methodological issue.
The CSJ compares March 2026 benefit claimant counts with Office for National Statistics estimates of the working-age population from mid-2024.
That is a gap of approximately 21 months.
In small areas, often containing only a few hundred residents, changes in population can materially affect the resulting percentage.
Consider an area with 100 working-age residents in 2024 and 55 claimants in 2026. The published methodology produces a rate of 55%.
If the working-age population had increased to 120, the rate would be 45.8%, and the neighbourhood would no longer qualify as a hotspot.
This is an illustration, not a claim that the CSJ has made this particular error. But it demonstrates why a responsible analysis should test the sensitivity of its results to population changes.
The CSJ says it excluded areas with very small working-age populations and those failing consistency checks. That is sensible, but it does not eliminate the problem of using population estimates from a different period.
Until the full technical analysis is available, the robustness of the threshold classifications cannot be independently established.
The Telegraph makes no serious attempt to explain this uncertainty.
2. The 860,000 residents who are not 860,000 claimants
The CSJ reports that approximately 860,000 people live in these neighbourhoods.
That figure is then used to reinforce the impression of widespread welfare dependency.
But these are residents, not claimants.
They include children, pensioners, people in employment and people who do not receive the benefits being examined.
The same problem occurs with the claim that almost six million people live in approximately 19,000 neighbourhoods where more than one third of working-age adults are counted as out-of-work benefit claimants.
Those six million people are not six million benefit claimants.
The difference is fundamental.
It is perfectly legitimate to report how many people live in areas of concentrated disadvantage. It is not legitimate to allow readers to confuse the population of those areas with the number receiving benefits.
There is a further distinction between households and individuals.
A household receiving an out-of-work benefit may contain somebody in employment. A household may contain several adults, only one of whom receives a qualifying benefit.
Moving between household statistics, individual claimant counts and total neighbourhood populations without carefully explaining the denominators creates a profoundly misleading picture.
This is not a minor matter of presentation. It changes what the statistics appear to say.
3. Universal Credit is not an unemployment register
Perhaps the most damaging weakness in the narrative is the repeated association of benefit receipt with unemployment.
Universal Credit supports people in employment as well as people out of work.
It supports people with limited capability for work, people with caring responsibilities and households whose earnings are insufficient to meet their assessed needs.
A person can receive Universal Credit while working. A person can receive Personal Independence Payment while working. A person may have no work-search requirement without being unemployed in the conventional statistical sense.
The CSJ’s neighbourhood analysis uses a defined category from DWP Benefit Combinations statistics. That may be a valid administrative measure, but it is not automatically equivalent to the unemployment rate.
Nor does it establish whether somebody could realistically take a job.
There is a considerable difference between a healthy person who is available for employment but cannot find work, somebody undergoing treatment for a serious illness, a disabled person whose condition substantially restricts their capacity to work, and a carer providing essential unpaid support.
Lumping them together as evidence of a welfare trap is analytically crude.
It also has consequences.
If policymakers misunderstand the composition of the claimant population, they will misunderstand the interventions required.
Someone who needs rehabilitation, flexible employment or mental health treatment is unlikely to benefit from the same intervention as someone who needs skills training or help finding a vacancy.
The fact that both appear in an administrative benefit category does not make their circumstances equivalent.
4. The 6.7 million claimants: a large number without a convincing explanation
The CSJ reports that 6.7 million working-age people receive at least one benefit within its out-of-work definition, compared with 3.9 million in 2019.
That represents an increase of 2.8 million, or approximately 71.8%.
It is substantial.
But what does it actually mean?
The number of claimants is not the same thing as the number of people who have chosen not to work.
To explain the increase, we need to know how much reflects deteriorating health, changes in the severity of illness, movement from legacy benefits into Universal Credit, changes in assessment and entitlement, population changes and actual changes in employment status.
We also need to understand the effect of the pandemic and its aftermath.
The CSJ is entitled to argue that the benefit system contributes to economic inactivity. But establishing that requires evidence about causation.
An increase in claims does not, on its own, establish that benefit generosity caused people to leave employment.
It is equally possible that deteriorating health caused both reduced employment and increased benefit claims.
Both mechanisms may operate simultaneously.
The task of serious research is to distinguish them, not to assume that one explains the other.
5. The £136 billion welfare bill: large, real and badly explained
The CSJ reports that working-age benefit expenditure is forecast to reach £136.1 billion in 2026–27.
It compares this with £86.5 billion in 2019–20, expressed in 2026–27 prices.
That is a real-terms increase of £49.6 billion, or approximately 57.3%.
These figures are substantial and should concern policymakers.
But the £136.1 billion is not simply the cost of unemployment.
Working-age benefits include support associated with disability, ill health, low earnings, housing costs and other circumstances.
A significant proportion of this expenditure supports people who cannot reasonably be expected to work or who already work.
The CSJ’s headline does not explain how much of the increase arises from additional claimants, how much from changes in average awards, how much from the composition of the caseload and how much from other factors.
Those distinctions are essential if the purpose is to identify what reform might achieve.
The CSJ also translates the £49.6 billion increase into approximately £1,200 per income taxpayer.
The calculation is straightforward: divide £49.6 billion by roughly 41 million taxpayers.
But that does not mean each taxpayer has actually paid £1,200 more in tax because of the increase.
It is a rhetorical allocation of expenditure, not a calculation of individual tax liability.
Government spending is financed through the wider fiscal system, including taxation and borrowing. The distribution of the tax burden is not uniform.
Furthermore, welfare expenditure is not money that disappears from the economy. Much of it is spent on housing, food, energy and other necessities.
That does not make the expenditure free, nor does it remove the need to manage public finances.
But it does mean that treating the entire sum as an economic loss is an incomplete analysis.
Public expenditure is a cost to government. It is not necessarily a loss of equivalent value to the wider economy.
6. The £27,400 benefit package: an especially questionable comparison
The CSJ has now published another attention-grabbing claim.
It argues that a single economically inactive claimant can receive approximately £27,400 a year in combined benefits, and that a minimum-wage worker would need to work more than 50 hours a week to achieve equivalent take-home pay.
This deserves particularly close scrutiny.
The example is not an average claimant.
It is a constructed scenario involving a single person over 25 receiving Universal Credit, the protected health-related element, housing support based on a specified Local Housing Allowance assumption, and both components of Personal Independence Payment at enhanced rates.
The CSJ acknowledges these assumptions in its notes.
The calculation may be arithmetically correct for that particular combination of entitlements.
But presenting it as evidence that welfare is generally more financially attractive than employment is misleading.
First, PIP is intended to contribute towards the additional costs associated with disability.
It is not simply a substitute for earnings.
Second, housing support is intended to meet housing costs. Treating housing assistance as though it were freely disposable income, while comparing it with a worker’s take-home pay before housing costs, is not a meaningful assessment of living standards.
Third, PIP is not generally withdrawn when someone enters employment.
Consequently, the relevant comparison is not between total benefits received while out of work and the wages of somebody who does not receive disability support.
It is between the claimant’s financial circumstances out of work and their circumstances if they entered employment, taking account of retained benefits, earnings, taxes, benefit withdrawal and additional costs.
Fourth, the CSJ’s example assumes substantial health-related entitlements. The very circumstances giving rise to those entitlements may also limit the person’s ability to work.
There is an uncomfortable implication in the comparison: that the income of somebody with significant disabilities should be judged against the earnings of a person who does not face the same additional costs or barriers.
That is not a neutral comparison.
The CSJ further claims that approximately 6.2 million full-time workers take home less than its illustrative benefit package.
But this does not mean those workers would receive £27,400 if they stopped working.
Most would not meet the qualifying conditions.
The comparison therefore tells us very little about the financial incentive actually facing the average employee.
It creates the impression that millions of workers are making an economically irrational choice by remaining employed.
The evidence does not establish that.
An exceptional or carefully selected benefit package is not a representative measure of welfare generosity.
If the CSJ wants to demonstrate a widespread financial disincentive to employment, it should publish distributions of actual awards and model the financial gain from work across representative household circumstances.
That would be a far more convincing exercise.
7. Disability is not evidence of moral failure
The Telegraph reports a 61% increase in the incapacity benefit caseload alongside a 16% increase in disability prevalence.
The juxtaposition appears designed to suggest that benefit claims have increased far more rapidly than genuine disability.
But disability prevalence and incapacity benefit caseloads are not interchangeable measures.
Many disabled people work.
Some people with serious illnesses are unable to work but may not have been counted as disabled in an earlier survey.
The severity of conditions, access to treatment, assessment rules and the characteristics of available employment all influence whether somebody claims health-related benefits.
It is reasonable to ask why incapacity claims have risen so sharply.
It is unreasonable to assume that the difference between the two growth rates represents unjustified dependency.
That conclusion requires evidence the article does not provide.
We should also be cautious about claims concerning mental health.
The rise in reported mental health difficulties is a serious social and public health issue.
It may reflect changes in underlying prevalence, awareness, diagnosis, reporting and access to services.
The relationship with economic inactivity requires investigation.
But dismissing the increase as evidence that the welfare system has become too generous risks substituting political prejudice for clinical and economic analysis.
8. The Telegraph’s own interviews undermine its narrative
Perhaps the most revealing part of the Telegraph’s reporting is the evidence provided by the people it interviews.
One man describes losing employment after a serious knee injury, struggling to walk, being unable to find suitable work and being refused PIP twice.
Another describes mental health difficulties and repeated unsuccessful job applications.
These are not persuasive illustrations of people enjoying a comfortable existence funded by the state.
They are accounts of illness, insecure employment, poverty and unsuccessful attempts to obtain work.
Yet they are placed within a narrative of welfare dependency.
The newspaper also features a man receiving PIP, despite PIP not being an unemployment benefit.
That distinction should be obvious to a journalist writing about welfare.
PIP is available to eligible people whether or not they work.
Using a PIP recipient to illustrate a story about people supposedly choosing benefits over employment invites readers to draw precisely the wrong conclusion.
It is difficult to avoid the impression that the article was constructed around a predetermined narrative, with individual stories selected to provide colour rather than to test the underlying argument.
There is a difference between journalism that investigates a problem and journalism that illustrates a conclusion already reached.
The latter may make for a striking headline. It does little to improve public understanding.
9. Iain Duncan Smith should be required to account for Universal Credit’s record
Duncan Smith presents the introduction of Universal Credit as a major success, citing improvements in employment, reductions in workless households and savings to the benefit system before the pandemic.
He then argues that the system has deteriorated into a new welfare trap.
There are several problems with this account.
First, improvements in employment between 2010 and 2019 cannot simply be attributed to Universal Credit.
The period included wider changes in the economy, employment patterns, demographics and public policy.
Establishing the contribution of UC requires more than observing that employment increased after reform began.
Second, UC was introduced over an extended period. The timing and coverage of its implementation matter when assessing its effect on national employment statistics.
Third, if UC is now producing incentives that Duncan Smith considers unacceptable, the obvious question is which elements of the system are responsible.
Which rules changed? Which payment rates altered the incentives? Which assessment arrangements had measurable effects?
And how much of the present problem arises from the original design?
Duncan Smith cannot reasonably claim credit for every favourable development during the earlier period while attributing unfavourable developments entirely to subsequent decisions.
A serious evaluation must apply the same standard of evidence to successes and failures.
His claim that earlier reforms saved £28 billion also needs a transparent baseline and explanation of the counterfactual.
Saved compared with what? Over what period? Against which expenditure forecast?
Without those details, the figure cannot be treated as proof of the success of the reforms.
10. Where are the jobs, and who can realistically do them?
The CSJ identifies concentrations of benefit claims in Birmingham, Liverpool, Sheffield, Bradford, Blackpool and other areas.
But counting claimants is only the beginning of an investigation into economic inactivity.
What is the local availability of suitable employment?
What are the wages, working hours and transport requirements?
How many vacancies offer flexibility for people with fluctuating health conditions?
What happens to someone who takes a job, loses it after several weeks and must then navigate a return to benefits?
How many employers are prepared to recruit and support people with significant health limitations?
What has happened to local access to NHS treatment, rehabilitation and mental health services?
These questions are central to the problem.
Reducing someone’s benefits does not create a job.
It does not cure an illness, provide a bus service, improve an employer’s recruitment practices or make unsuitable work sustainable.
There may be circumstances in which benefit rules discourage employment. Those should be identified and corrected.
But there is no reason to assume that reducing the generosity of the system is necessarily the most effective response.
Indeed, for some households, greater financial insecurity may make entering or sustaining employment more difficult.
11. Britain needs a financial resilience debate, not another dependency campaign
There is a better way to examine the circumstances of the communities identified by the CSJ.
Rather than simply counting benefit claimants, we should examine household financial resilience.
How many households could meet an unexpected expense?
How many people in employment remain dependent on means-tested support?
How many households would be pushed into hardship by higher council tax, rent, energy bills or transport costs?
How many people receiving no support are nevertheless close to financial crisis?
How many residents have conditions that make employment difficult but could work with appropriate adjustments?
These questions are particularly relevant to local government.
Councils already encounter financial vulnerability through Council Tax Reduction, discretionary support, housing services, debt recovery and local welfare assistance.
Those datasets, handled lawfully and appropriately, can help authorities understand household circumstances more effectively.
They can also support Equality Impact Assessments and the design of policies that do not inadvertently increase hardship.
The distinction is important.
A household receiving benefits is not necessarily financially secure.
A household in employment is not necessarily financially resilient.
And a household receiving no benefits is not necessarily free from poverty.
If the objective is to reduce the long-term need for public support, financial resilience is a far more useful policy outcome than simply reducing claimant numbers.
12. The CSJ is entitled to a political philosophy. It is not entitled to confuse that philosophy with proof.
The Centre for Social Justice has a longstanding commitment to welfare reform and the belief that the benefit system can contribute to dependency.
It is entitled to advance that position.
But its conclusions should be judged against the same evidential standards as those of any other research organisation.
There is a distinction between demonstrating that health-related benefit expenditure has increased and demonstrating that benefit generosity has caused that increase.
There is a distinction between identifying concentrations of benefit claims and proving that the people concerned are unwilling to work.
There is a distinction between constructing an illustrative high-value benefit package and establishing the financial incentives faced by typical claimants.
And there is a distinction between arguing that welfare reform is necessary and demonstrating that reducing entitlement will improve employment outcomes.
The CSJ’s initial publications provide evidence of rising expenditure and geographically concentrated claims.
They do not, on their own, establish the causal explanation being advanced.
The Telegraph should have tested those claims rather than presenting the CSJ’s interpretation as though it followed automatically from the numbers.
This is especially important because welfare reporting has real consequences.
It influences public attitudes towards disabled people, unemployed people and households experiencing poverty.
It also influences the political environment in which decisions are made about entitlement, conditionality and public expenditure.
Journalists and think tanks are entitled to challenge the welfare system robustly.
But they should be equally rigorous about their own evidence.
Conclusion: Britain has an economic problem. Blaming the benefit system is not a substitute for solving it.
The real scandal is not that some of Britain’s poorest communities receive substantial amounts of welfare support.
It is that, after decades of economic policy and successive programmes of welfare reform, too many of those communities remain poor.
Iain Duncan Smith describes the welfare system as an economic opiate.
But perhaps the more uncomfortable possibility is that welfare payments have become a means of managing the consequences of economic failure: poor health, inadequate wages, insecure employment, unaffordable housing and communities with insufficient opportunity.
That does not mean the benefit system is beyond criticism.
It means that its effectiveness must be judged by whether it improves people’s circumstances, supports employment where appropriate, protects those unable to work and contributes to financial resilience.
The objective should not simply be fewer claimants.
It should be fewer people needing support because they have better health, better opportunities, sustainable employment and greater financial security.
Those who cannot work should be supported with dignity, not treated as statistical evidence of national decline.
Those who can work should be helped into employment that is suitable, sustainable and financially worthwhile.
And those already working should not have to rely on an inadequate income simply because the labour market fails to provide sufficient reward.
The CSJ and the Telegraph have identified figures that deserve serious attention. But they have not demonstrated that welfare generosity is the principal cause of the problems they describe.
Until they do, the language of dependency remains an interpretation, not an established finding.
Britain does not need another campaign to persuade the public that benefit claimants are the problem. It needs an economic and social policy capable of reducing the circumstances that make benefits necessary.
That would be a genuine programme of social justice.
Sources and methodological note
This article draws on the Telegraph reporting supplied for review and the Centre for Social Justice’s publications of 11 and 12 October 2026, including its stated methodology for neighbourhood claimant estimates and its illustrative £27,400 benefit comparison.
The full State of Dependency report is scheduled for publication on 13 October 2026. Consequently, this article distinguishes between arithmetic that can be checked from the published material and causal claims that have not yet been independently established.
The separately supplied CSJ report, Inactive Nation: Part Two – Getting England’s Teenagers Moving, concerns teenage physical activity and is not the source of the welfare statistics discussed here.
The criticism is directed at the published evidence, the statistical presentation and the conclusions drawn from it. It does not assert that the underlying DWP figures were fabricated.
Primary sources
- Centre for Social Justice, Revealed: The 3,000 Areas with Over Half of Working-Age Adults on Benefits, 11 October 2026.
- Centre for Social Justice, Revealed: Minimum-Wage Worker Must Work Six Days a Week to Match Combined Benefits, 12 October 2026.
- Department for Work and Pensions, Benefit Combinations Statistics, March 2026, as cited by the CSJ.
- Office for National Statistics, mid-2024 Output Area population estimates, as cited by the CSJ.