

In 2024/25, councils in England raised £258million in court costs for the non-payment of council tax, sending more than three million households to court.
These new findings are part of our upcoming report, Debt on Debt.
However, last week the government announced a cap on council tax court charges across England, limiting the costs to residents at £100 per case. And we just so happen to have a lot of useful data.
So while our wider research is focused on the overall costs, and impact, of council tax enforcement, this mini-report looks at the changes the new £100 cap may bring from 2027/28 onwards.
This concession to cap costs appears, on the surface, to be significant. But these changes will only impact residents living in 25% of local authority areas where charges are above £100 already.
For the remainder of councils, could this change trigger a race to £100? If it does, those councils would be, collectively, at least £28m a year better off in terms of revenue raising on court fees, while councils forced to lower their charges will face a £12m revenue gap from next year.
Using data gathered via FOI enquiries, this article looks at the impact and distribution of council tax court fees finding an uneven distribution of charges, a concentration of higher fees in London and the South East, and no apparent economies of scale or patterns to explain the variation in fees set by each council.
It’s also not clear how the government landed on the £100 court fee cap – but if their data was anything like ours, this change wasn’t based on existing fees…
A quick note on data
Data for this article is taken from an extensive FOI exercise exploring the costs of council tax enforcement using 2024/25 as a sample. Our upcoming research report, Debt on Debt, looks at the distribution, prevalence, and links to social outcomes of enforcement activity and associated costs.
As part of this work, we asked billing authorities in England and Wales for the cost of both a summons and liability order, along with the volume of recovery activity. As Wales already has a summons and liability order cap (£70), this article focuses on England only.
Of the 293 billing authorities asked, 257, or 88%, responded.
You can find more on our methodology here.
A cap that may push fees upwards
In total, in 2024/25, councils in England raised £258 million through summons and liability order costs, sending more than three million accounts, just short of 12% of all households, to court.
Looking first at the revenue impact for councils, only around a quarter of councils currently charge above £100 and will therefore need to reduce their fees. The estimated revenue impact of this is around £12 million per year across all councils, not individually.
However, for the majority of councils charging below £100, the cap creates potential headroom and if those councils were to increase their fees up to the cap, this could generate an additional £28 million per year.
The financial incentive to increase fees is therefore significantly larger than the pressure to reduce them.
This creates a clear policy risk: that a measure intended to limit costs for residents could instead lead to upward convergence, with more councils moving towards £100 over time.

What do fees look like today?
Across England, the average combined court fee in 2024/25 (summons plus liability order) was £82.95. But this median is hiding variation from £37.50 in Exeter to £172 in Dover.
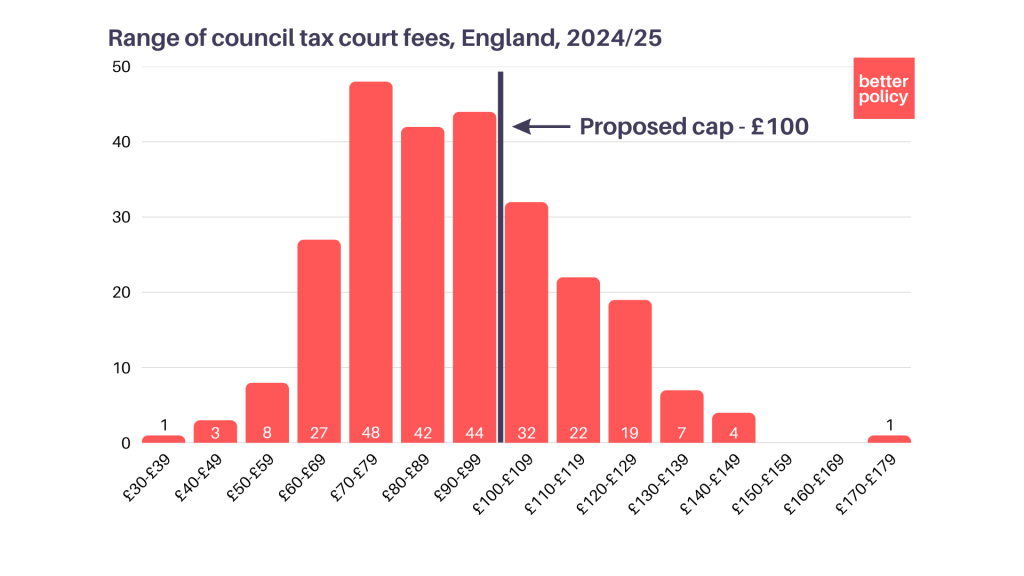
As council tax never fails to disappoint when it comes to postcode lotteries, fee levels are not distributed evenly across the country and households finding themselves in court for non-payment of council tax can face widely different charges.
However, unlike many of the regressive trends we see in council tax, our data shows higher charges are concentrated in London and the South East, with 84% of London boroughs and 47% of councils in the wider South East already charging more than £100.
In contrast, much of the North and Midlands tends to cluster below the proposed cap, often with lower and more tightly grouped fees.

What explains the variation?
You’d be forgiven for thinking that charges therefore track with deprivation, with lower fees on average seen in more deprived areas – but inner London boroughs with higher levels of deprivation see some of the highest charges in the country.
When correlated with deprivation, we see no pattern.
So we tested a range of potential explanations to understand why fees vary so widely across councils. These tests included levels of deprivation (both IMD score and percentage of wards in the most deprived decile), the proportion of households receiving Universal Credit, rates of enforcement activity, and council size.
None of these factors show a meaningful relationship with fee levels. Councils with similar levels of deprivation, similar enforcement activity, and similar scale often charge very different fees. Conversely, councils with very different characteristics frequently charge similar amounts.
Finally, when looking at council type, the only significant difference we find is that London Boroughs charge disproportionately more than other councils.
This lack of relationship to other factors may suggest that variation in fees is not driven by underlying need, operational pressure, or economies of scale, but instead reflects differences in local policy choices and administrative approaches.

How are costs actually calculated?
Under current regulations, councils are expected to base court fees on the “reasonable costs” of enforcement.
In practice, there is no consistent approach to how these costs are calculated.
Analysis of council responses reveals a wide range of fundamentally different methodologies.
Some councils use detailed activity-based costing models, calculating staff time, support costs, and operational expenses per case. Others allocate a proportion of overall service budgets to enforcement activity and divide this across case volumes.
In some cases, costs are derived from proxy measures — such as the volume of notices issued — rather than direct measurement of activity. Elsewhere, councils rely on historic cost agreements that have not been updated for many years, or provide only high-level justifications without any supporting calculation.
Even among councils that do calculate costs, there is significant variation in what is included. Some limit costs to direct administrative activities, while others include a much broader range of expenditure, including overheads, IT systems, customer contact services, and corporate recharges.
As a result, councils are not simply arriving at different answers — they are often calculating entirely different things.
So if fee structure is not based on typologies, and not on how costs are calculated, are we looking at vibes-based costing, or something else?
And as court costs are a form of revenue for councils, could it be that budget pressures are dictating fee levels, and if this is the case, has the government given implicit permission to drift upwards towards £100?
Will the cap deliver positive outcomes for vulnerable households?
The government’s assessment suggests that the reforms are likely to have a disproportionately positive impact on groups more likely to experience financial disadvantage.
However, the evidence presented here suggests that the distributional effects of the cap may be more complex.
First, only around a quarter of councils currently charge above £100, meaning that the direct financial benefit is concentrated in a relatively small number of areas. Second, higher fees are geographically clustered, particularly in London and the South East, rather than being systematically associated with more deprived areas.
More importantly, the analysis highlights a clear policy risk. The financial incentive for councils below the cap to increase fees is larger than the pressure on those above the cap to reduce them. If this results in upward convergence towards £100, some households — including those in more financially vulnerable circumstances — could face higher costs as a result of the reform.
Taken together, this suggests that the impact of the cap is unlikely to be uniformly positive, and may depend on how councils respond to the new framework.
What this means
Taken together, these findings point to a system that lacks consistency at multiple levels.
- Fee levels vary widely across councils.
- This variation is not explained by need, scale, or enforcement activity.
- Councils use fundamentally different methods to calculate costs.
- And there is no clear link between calculated costs and the charges applied.
This inconsistency has important implications for fairness and transparency. Households in similar circumstances face very different charges depending on where they live, and there is limited clarity about what those charges actually reflect.
The government did consult on court fee caps and, despite only 16% of respondents signalling their preference for a cap over £70, the government arrived at £100. This move could ultimately trigger a race to £100 for the 75% of councils not currently charging more than this.
Alongside other changes not discussed in this blog — final notices will be delayed for 63 days, bills will default to 12 instalments rather than 10, and changes to some exemptions — how councils respond will be key. And like much of council tax policy, we can expect a variety of different responses.
What this analysis highlights is not just variation in fees, but a lack of shared understanding of what those fees are intended to represent. Without a consistent framework for defining and calculating costs, the cap risks becoming a focal point for fee-setting rather than a constraint.
For now, the direction of travel is uncertain. The government has signalled willingness to intervene, but whether this amounts to meaningful reform — or simply a rebalancing of an already inconsistent system — remains to be seen.
Further methodological notes on analysis
In addition to collecting fee and activity data, further analysis was undertaken to explore patterns in how court fees are set and whether variation between councils could be explained by underlying factors.
Combined court fees were calculated as the total of summons and liability order charges for each authority. These were analysed both as simple averages and weighted by the volume of summons activity, to reflect the distribution of enforcement across the system.
To understand whether differences in fees reflect underlying characteristics of local authorities, a range of variables were tested for correlation with fee levels. These included:
- levels of deprivation, using Index of Multiple Deprivation (IMD) scores and the proportion of neighbourhoods in the most deprived decile
- the proportion of households receiving Universal Credit
- enforcement activity, measured as summons issued per 1,000 households
- total volume of summons activity
- council size, using the number of dwellings
Across all variables tested, no meaningful relationship with fee levels was identified.
To further explore the distribution of enforcement activity, summons volumes were grouped by fee band. This allowed analysis of how total enforcement activity is distributed across councils charging different levels of fees, highlighting the extent to which higher-fee authorities account for a disproportionate share of overall activity.
In parallel, qualitative analysis was undertaken of council responses relating to how costs are calculated. Around 250 responses providing cost breakdowns or explanatory detail were reviewed and grouped into broad methodological categories, including activity-based costing, apportionment models, and cases where no clear methodology was provided.
This combined quantitative and qualitative approach allows for both an assessment of system-wide patterns in fee levels and a deeper understanding of how those fees are constructed in practice.